Guide to Responsible Data Practices
In this book, we explore how information becomes powerful through stories and easy activities.
By:- Megha
About Book
Title: Guide to Responsible Data Practices
Author: Megha Jibhakate
Acknowledgements:
I want to express my deepest gratitude to everyone who helped me with this book! Especially to my mentor Shemeer, who always encouraged me and helped me with ideas, Sumi, who assisted with content other tasks, and Jinso, who provided tech support. Your help and ideas made this book possible, and I am truly grateful for all your support.
About This Book:
Welcome! This book is all about helping you understand and enjoy exploring data. You will learn how information is collected, find patterns, and discover what it all means. Whether you are new to data or already know a bit, this book makes learning easy and exciting.
Happy exploring!
Thank You.
Case study
Analysing Education Data from 1.4 Million Schools
Introduction:
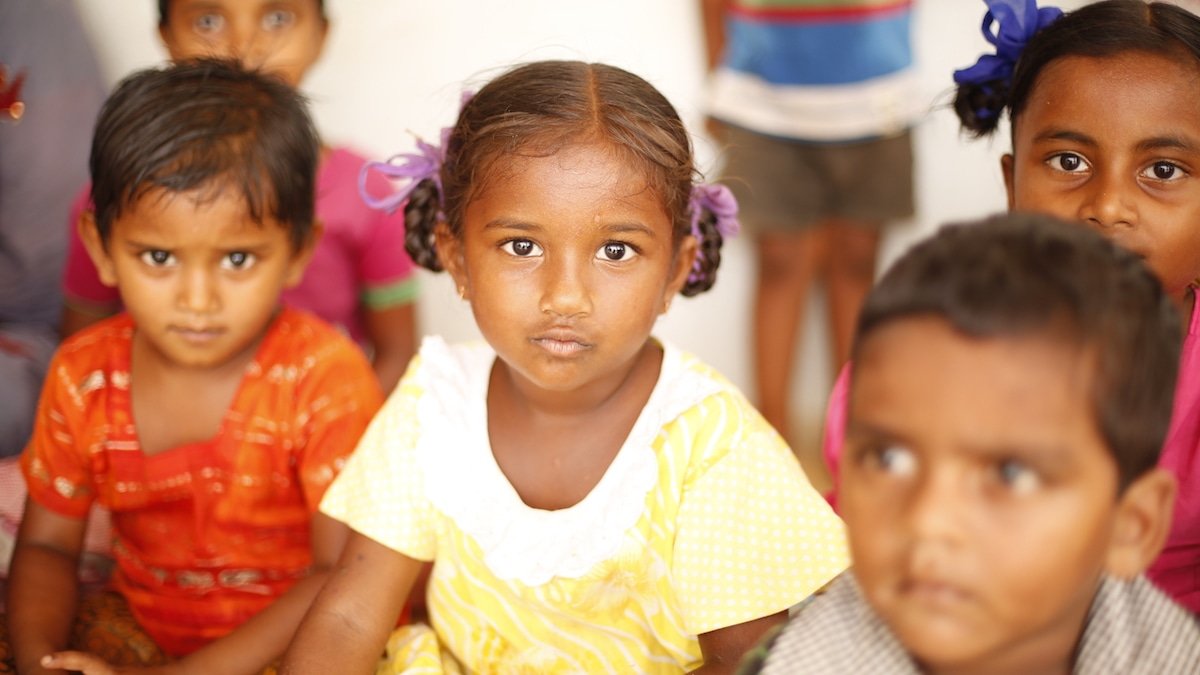
After India introduced the Right to Education (RTE) Act eight years ago, just 8% of schools are following its rules. Working together with Oxfam India, Socialcops and Oxfam took on an important mission to bring attention to this problem. Their plan was to make a dynamic scorecard that shows which districts are doing well and which ones need to do better when it comes to following the RTE rules.
Background:
Even though the RTE Act was introduced in 2009 to set important rules for schools, only 8% of Indian schools were following all the rules by 2015. To tackle this issue, Oxfam India started the "Haq Banta Hai" campaign. The goal was to make people aware and encourage schools to follow all the RTE rules, especially focusing on things like having the right number of teachers for students and providing proper facilities like toilets.
The Challenge:
Making people aware of education problems needed a thoughtful plan.Oxfam India and Socialcops wanted to create a special scorecard that shows how well each district is doing. This scorecard wasn't just for letting the public know; it was also meant to tell Members of Parliament where their districts needed to do better.
The Solution:
To solve this problem, Oxfam India and Socialcops joined forces to think up and make a scorecard that uses data to show how well RTE rules are being followed. They collected information from 1.4 million schools, checked how each district was doing, and shared the results on a dashboard that everyone could see and understand.
-
Implementation Process
(Key Features)-
Collecting Information:
They gathered details from all 1.4 million schools, checking things like how many students each teacher has and if there are proper toilet facilities.
-
Creating Scores:
Their data experts carefully cleaned and double-checked the information. Then, they gave importance to each aspect to create a detailed score for how well each district follows RTE rules.
-
Showing the Information:
They used a user-friendly dashboard to display the details. This made it easy to compare districts, search for specific details, and interact with a scorecard.
-
Results:
The campaign did really well, getting over 430,000 signatures in support. The interactive scorecard showed where things could get better and pointed out districts doing great in following RTE rules. This helped people learn more and be more involved.
This case study shows how we use data to make a positive difference in society, especially in helping education rights in India move forward.
Gratitude:
Thanks a lot, Socialcops and Oxfam, for teaming up and making a difference in Indian education! I made this case study by rewriting the original from [Original Case Study Link]. I simplified it and said things again, being thankful for the ideas in the original.
1.4 मिलियन स्कूलों से शिक्षा डेटा का विश्लेषण
परिचय:
आठ वर्ष पहले, जब भारत ने शिक्षा के अधिकार (Right to Education - RTE) अधिनियम को प्रस्तुत किया, तब से केवल 8% स्कूल इसके नियमों का पालन कर रहे हैं। Oxfam India, , और Socialcops ने मिलकर इस समस्या पर ध्यान केंद्रित करने के लिए एक महत्वपूर्ण मिशन लिया। उनकी योजना थी कि हम एक गतिशील स्कोरकार्ड बनाएं, जो दिखाए कि कौन से जिले अच्छा काम कर रहे हैं और कौन से और सुधार करने की आवश्यकता है जब शिक्षा के अधिकारों की बात आती है।
यहाँ तक कि 2015 तक, जब शिक्षा के अधिकार (RTE) अधिनियम को 2009 में प्रस्तुत किया गया था तब से केवल 8% भारतीय स्कूल इसके सभी नियमों का पालन कर रहे थे। इस समस्या का समाधान करने के लिए, Oxfam India ने "हक बनता है" अभियान शुरू किया। उसका लक्ष्य था लोगों को जागरूक करना और स्कूलों को सभी RTE नियमों का पालन करने के लिए प्रेरित करना, खासकर ऐसी बातों पर ध्यान केंद्रित करना जैसे कि छात्रों के लिए सही संख्या में शिक्षक होना और शौचालय की सही सुविधा प्रदान करना।
चुनौती:
शिक्षा समस्याओं के लोगों को जागरूक करने के लिए एक समझदार योजना की आवश्यकता थी। Oxfam India और SocialCops ने एक विशेष स्कोरकार्ड बनाने का निर्णय लिया जो दिखाए कि प्रत्येक जिले कैसे काम कर रहा है। यह स्कोरकार्ड सिर्फ जनता को बताने के लिए ही नहीं था, बल्कि यह सदस्यों को सांसदों को भी बताने के लिए था कि उनके जिले में कहाँ सुधार की आवश्यकता है।
समाधान:
इस समस्या का समाधान करने के लिए, Oxfam India और SocialCops ने मिलकर RTE नियमों का पालन कर रहे प्रत्येक जिले की अच्छाई को दिखाने के लिए एक स्कोरकार्ड बनाया। हमने 1.4 मिलियन स्कूलों से जानकारी जुटाई, यह देखने के लिए कि प्रत्येक जिला कैसा काम कर रहा है, और इन नतीजों को एक डैशबोर्ड पर साझा किया जिसे सभी देख सकते और समझ सकते थे।
प्रक्रिया
- जानकारी जुटाना:
उन्होंने सभी 1.4 मिलियन स्कूलों से विवरण जुटाए, जैसे कि हर शिक्षक के पास कितने छात्र हैं और क्या सही शौचालय सुविधाएं हैं।
- स्कोर बनाना:
उनके डेटा विशेषज्ञों ने जानकारी को सावधानीपूर्वक साफ किया और दोबारा जाँच किया। इसके बाद, उन्होंने प्रत्येक पहलुओं को महत्व दिया और प्रत्येक जिले के लिए विस्तृत स्कोर बनाने के लिए योजना बनाई।
- जानकारी दिखाना:
उन्होंने एक उपयोगकर्ता-मित्र डैशबोर्ड का उपयोग किया जिससे विवरण दिखाए जा सकते थे। इससे जिलों की तुलना करना, विशिष्ट विवरणों की खोज करना, और स्कोरकार्ड के साथ संवाद करना आसान हो गया।
परिणाम:
इस अभियान ने वास्तव में बहुत अच्छा काम किया, समर्थन में 430,000 से अधिक हस्ताक्षर प्राप्त किए। इंटरऐक्टिव स्कोरकार्ड ने दिखाया कि कहाँ सुधार हो सकता है और किन जिलों ने शिक्षा के अधिकारों का अच्छा पालन किया है। इससे लोगों ने और अधिक सिखने में सहायक होता है और उन्हें अधिक शामिल होने का मौका मिलता है।
यह केस स्टडी दिखाती है कि हम कैसे समाज में सकारात्मक बदलाव लाने के लिए डेटा का उपयोग करते हैं, खासकर भारत में शिक्षा के अधिकारों की सहायता करने में।
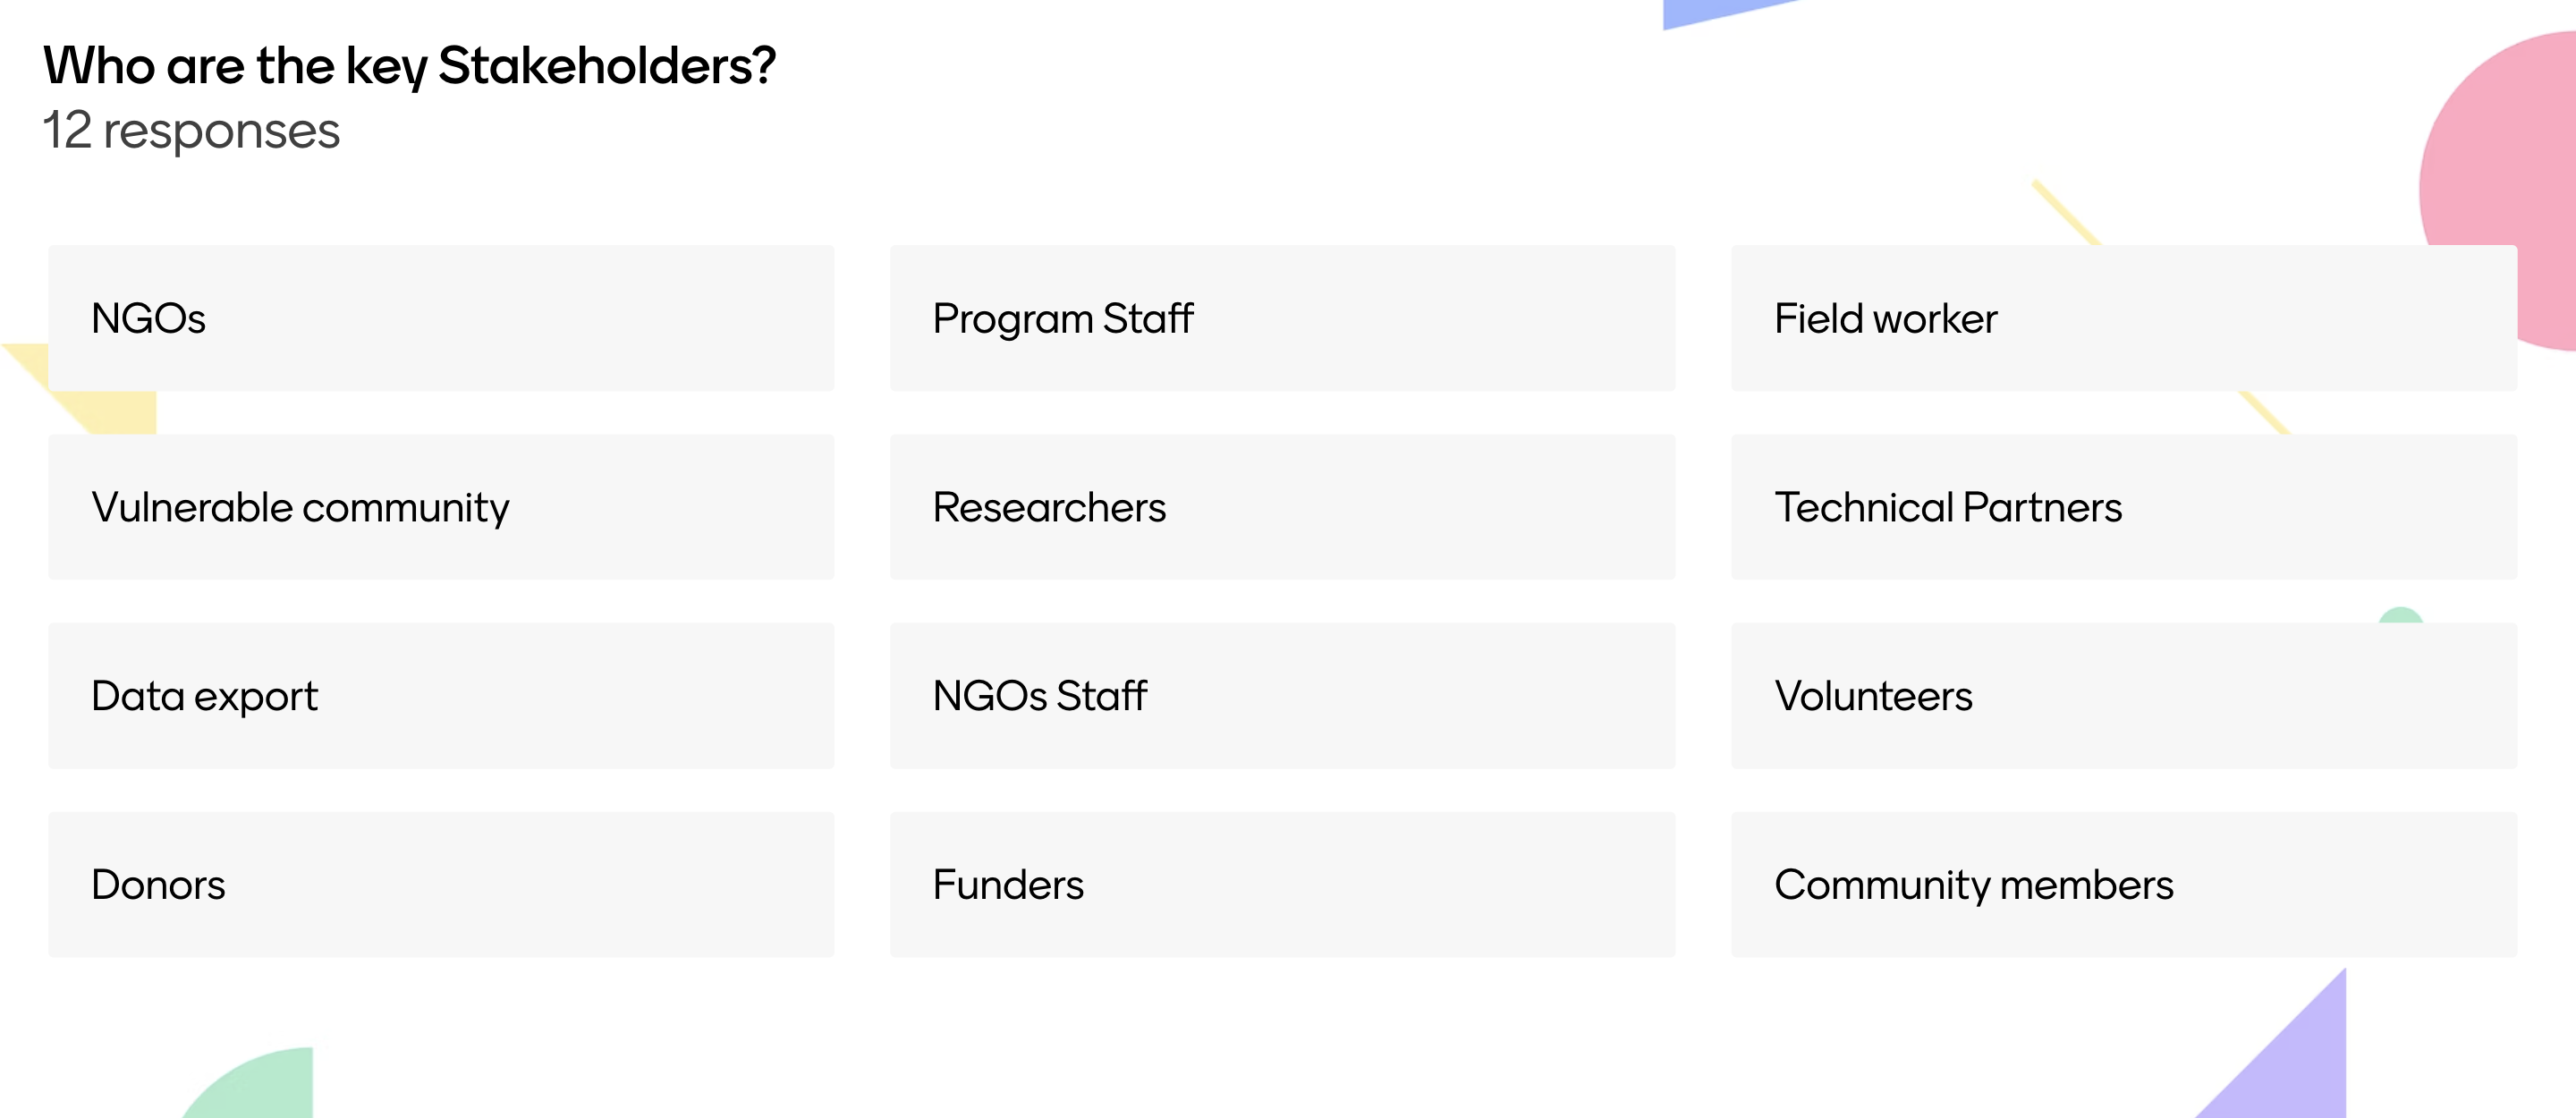
key Stakeholders
If you are working to solve the problem through data, let's begin by identifying who the key stakeholders are.
The Stakeholders
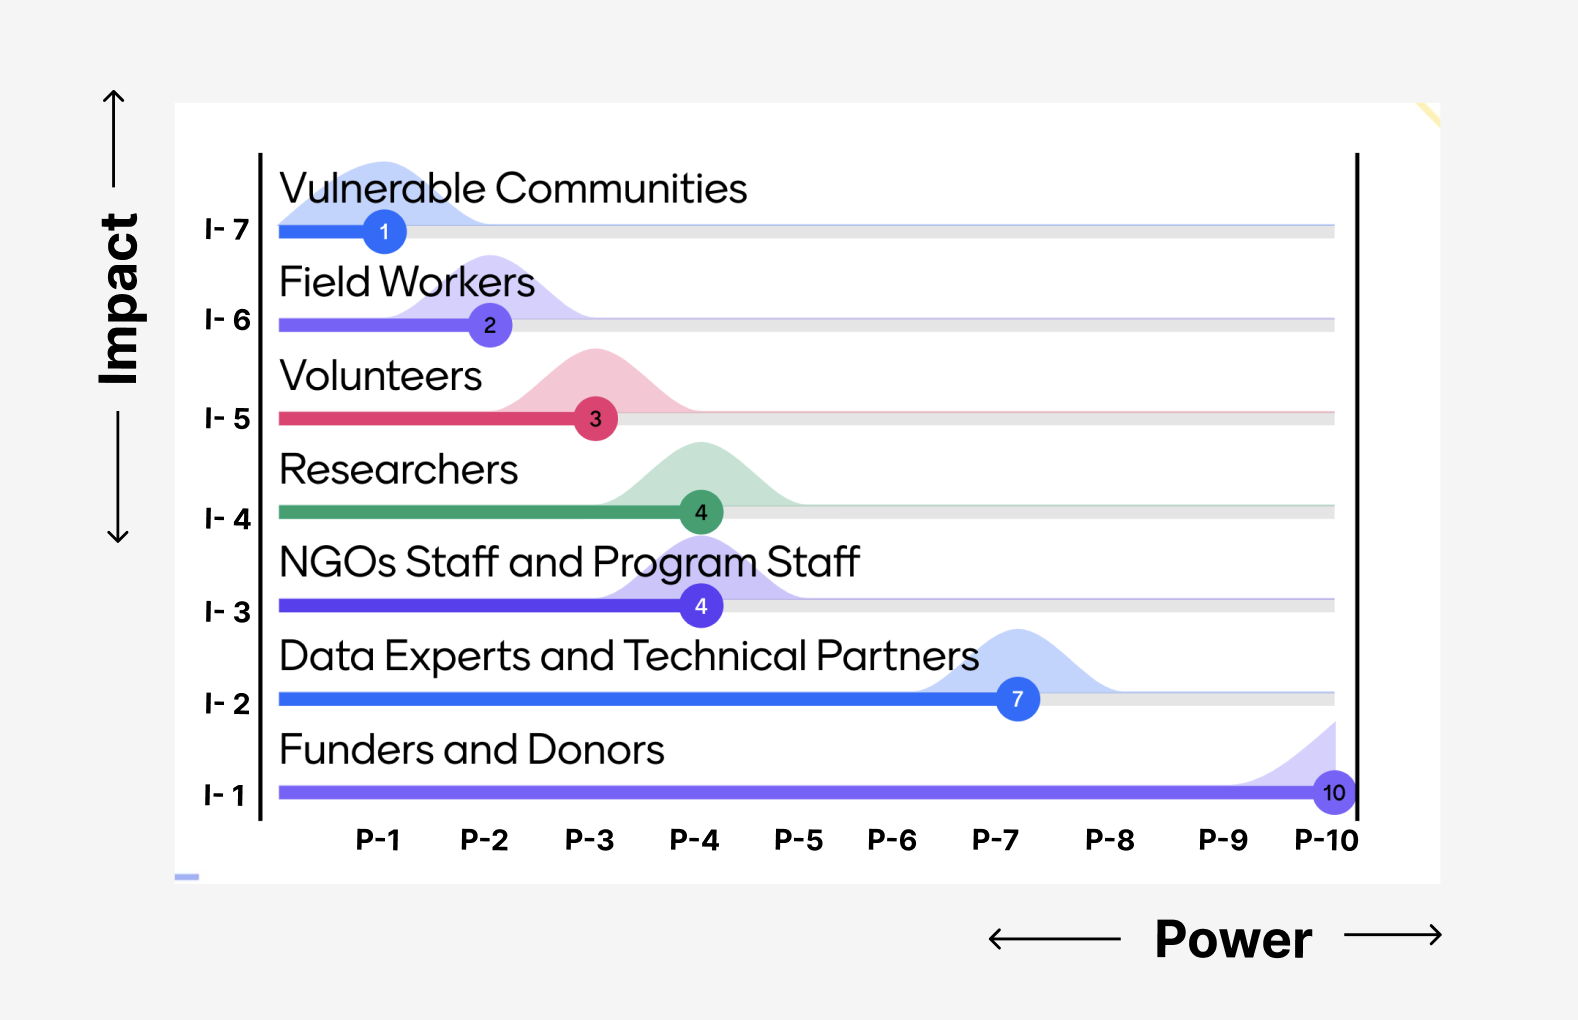
Power Map
Power Map
Hello Everyone! In this, we are going to do a small activity. We are going to figure out which stakeholders have a significant impact, even if they don't have a lot of power. And we will also see which stakeholders have a lot of power but maybe do not make as big of a difference. Let's get ready to learn.
Stakeholders :-
- Funders
- Vulnerable Communities
- Volunteers
- Donors
- Field Workers
- Researchers
- Data Experts
- Technical Partners
- NGOs Staff
- Program Staff
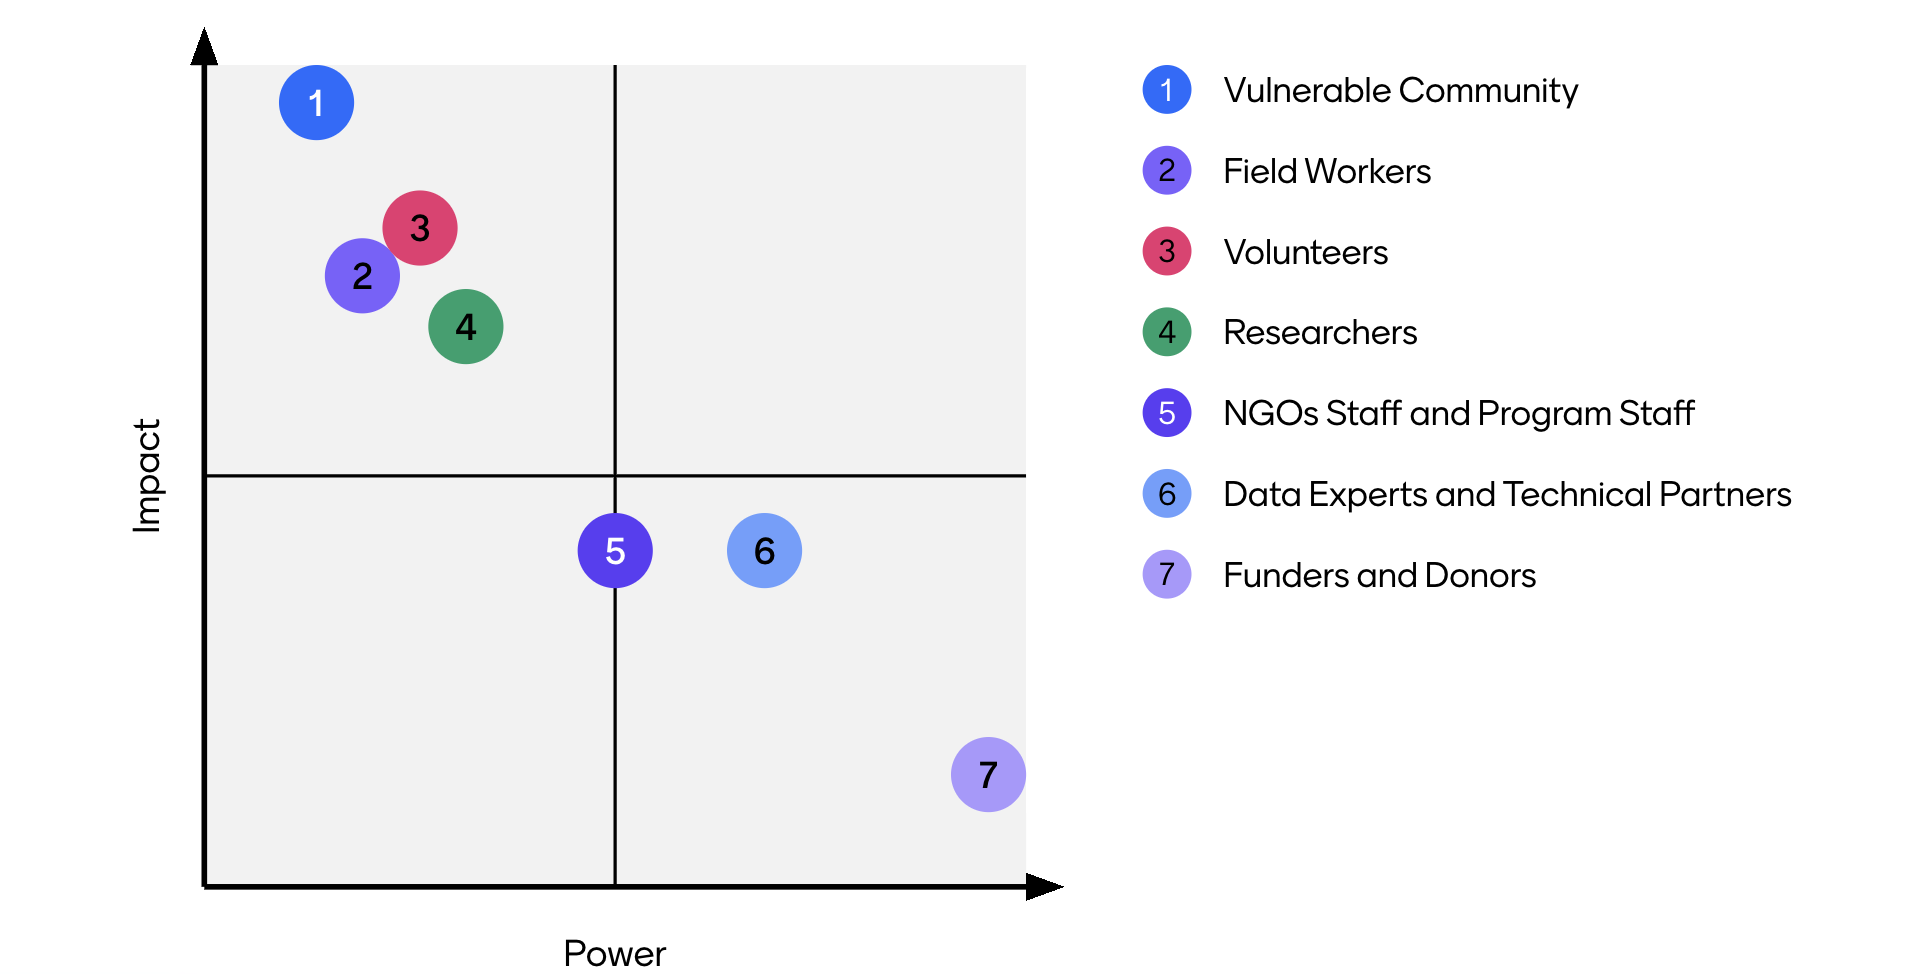
Power Map Example

Power Map Example 2

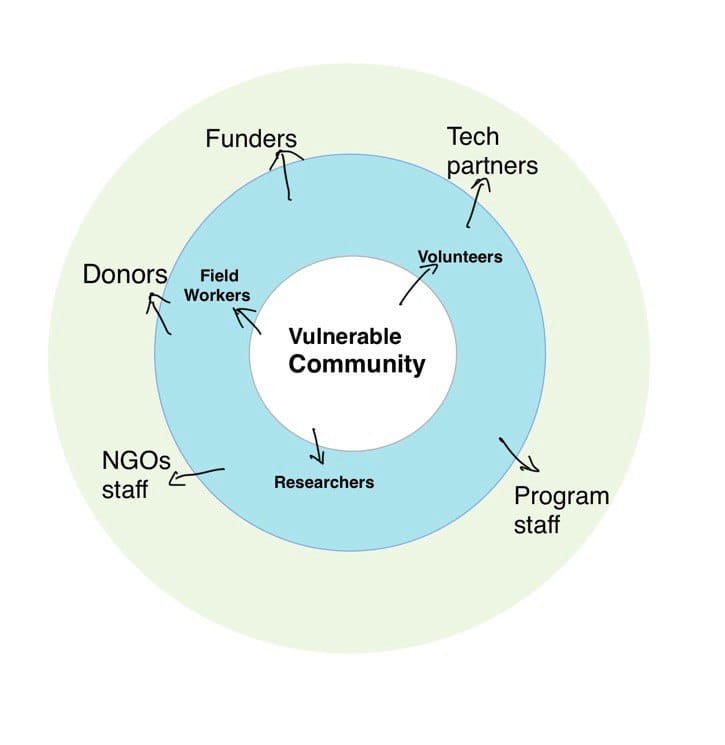
Most Valuable Pairs
Needs
Stakeholders Needs
Test